Category:Bode plots
Jump to navigation
Jump to search
graph of the frequency response of a linear system presented in logarithmic scale | |||||
| Upload media | |||||
| Instance of | |||||
|---|---|---|---|---|---|
| Named after | |||||
| |||||
- (en) Bode plot
- (ar) مخطط بود
- (de) Bode-Diagramm
- (es) Bode
- (fa) نمودار بدی
- (fr) Diagramme de Bode
- (it) Diagramma di Bode
- (nl) Bodediagram
- (pl) Charakterystyka Bodego
- (ru) ЛАФЧХ
- (sv) Bodediagram
A bode magnitude plot is a graph of log magnitude versus frequency, plotted with a log-frequency axis, to show the transfer function or frequency response of a linear, time-invariant system.
Media in category "Bode plots"
The following 183 files are in this category, out of 183 total.
-
3-dB bandwidth definition (logarithmic).png 225 × 225; 1 KB
-
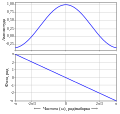
Amplitude & phase vs frequency for 3-term boxcar filter-ru.svg 723 × 684; 2 KB
-
Amplitude & phase vs frequency for 3-term boxcar filter.svg 435 × 400; 20 KB
-
Amplitude & phase vs frequency for a 3-term boxcar filter.gif 643 × 642; 17 KB
-
Amplituden Phasengang.svg 800 × 600; 109 KB
-
Anticipatory compensation network Bode plots.png 521 × 355; 4 KB
-
Aper 2.png 280 × 210; 18 KB
-
Aper bode.png 280 × 210; 14 KB
-
Asymptotic Bode plot.png 800 × 1,024; 53 KB
-
Asymptotic Bode plot.svg 800 × 1,024; 27 KB
-
Attenuating compensation network Bode plots.png 358 × 367; 3 KB
-
Band-pass filter.svg 2,770 × 1,550; 42 KB
-
Band-pass-filter 1.svg 512 × 293; 88 KB
-
Bandwidth comparison.JPG 649 × 281; 24 KB
-
BJT amplifier Frequency response-en.svg 880 × 500; 165 KB
-
BJT frequency response bode plot-en.svg 576 × 384; 168 KB
-
Bode 6.jpg 793 × 318; 33 KB
-
Bode bsp.png 505 × 404; 25 KB
-
Bode bsp.svg 525 × 394; 187 KB
-
Bode d.svg 525 × 394; 79 KB
-
Bode diagrams.svg 792 × 468; 71 KB
-
Bode High-Pass.PNG 645 × 565; 67 KB
-
Bode i.svg 525 × 394; 79 KB
-
Bode Low Pass Magnitude Plot.PNG 644 × 291; 42 KB
-
Bode Low Pass Phase Plot.PNG 643 × 290; 46 KB
-
Bode Low-Pass.PNG 645 × 565; 66 KB
-
Bode p.svg 525 × 394; 72 KB
-
Bode Plot (Frequency Response) of an Ideal Differentiator.svg 900 × 540; 87 KB
-
Bode Plot of Practical Differentiator when RC1=R1C.svg 900 × 540; 96 KB
-
Bode Plot of Practical Differentiator.svg 900 × 540; 55 KB
-
Bode plot template.pdf 1,239 × 1,754; 4 KB
-
Bode plot template.svg 875 × 1,250; 22 KB
-
Bode plot.jpg 1,167 × 1,183; 130 KB
-
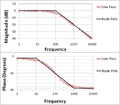
Bode Pole-Zero Magnitude Plot.PNG 648 × 293; 49 KB
-
Bode Pole-Zero Phase Plot.PNG 648 × 293; 55 KB
-
Bode-d.png 512 × 384; 8 KB
-
Bode-Diagramm-d.svg 600 × 480; 20 KB
-
Bode-diagramm-p.svg 600 × 480; 16 KB
-
Bode-diagramm-pt1.svg 600 × 480; 19 KB
-
Bode-i.png 512 × 384; 8 KB
-
Bode-margin 1 over s(s+2)(s+3).png 560 × 420; 6 KB
-
Bode-p.png 512 × 384; 6 KB
-
Bode-pt1.png 512 × 384; 9 KB
-
Bode-PT1.svg 525 × 394; 121 KB
-
Bode-pt2-var.png 514 × 387; 9 KB
-
Bode-pt2.png 512 × 384; 8 KB
-
Bode-PT2.svg 525 × 395; 283 KB
-
Bode-pt3.png 560 × 420; 7 KB
-
Bode010310.jpg 1,022 × 444; 58 KB
-
Bode020310.jpg 1,022 × 444; 60 KB
-
Bode1Asintotico.jpg 928 × 698; 97 KB
-
Bode2polesreels.JPG 851 × 1,241; 353 KB
-
Bode3.jpg 560 × 420; 19 KB
-
Bode4.JPG 793 × 318; 33 KB
-
BodeDiagram.jpg 781 × 493; 15 KB
-
Bodediagram.png 762 × 541; 7 KB
-
Bodediagramm Tiefpass.svg 360 × 360; 79 KB
-
Bodem03.JPG 847 × 1,231; 323 KB
-
Bodem08.JPG 835 × 1,243; 365 KB
-
Bodeplot.JPG 356 × 218; 18 KB
-
Bodeplot.png 337 × 176; 725 bytes
-
BodePlotEx Im001.jpg 717 × 366; 123 KB
-
BodePlotEx Im002.jpg 717 × 366; 133 KB
-
BodePlotEx Im003.jpg 726 × 366; 156 KB
-
BodePlotEx Im004.jpg 726 × 366; 161 KB
-
BodePlotEx Im005.jpg 457 × 174; 34 KB
-
Bodepoledouble.JPG 869 × 1,237; 365 KB
-
Butterworth filter bode plot de.svg 1,250 × 875; 81 KB
-
Butterworth filter bode plot ru.png 1,250 × 875; 82 KB
-
Butterworth filter bode plot ru.svg 1,250 × 875; 29 KB
-
Butterworth filter bode plot sv.svg 1,250 × 875; 32 KB
-
Butterworth filter bode plot-IT.svg 1,250 × 875; 29 KB
-
Butterworth filter bode plot.png 1,250 × 875; 110 KB
-
Butterworth filter bode plot.svg 1,250 × 875; 31 KB
-
Butterworth filter bodediagram.png 717 × 584; 5 KB
-
Butterworth II Order LPF Bode Plot.png 1,152 × 602; 46 KB
-
Butterworth orders.png 1,229 × 872; 93 KB
-
Butterworth orders.svg 800 × 600; 68 KB
-
Butterworth plain.png 1,296 × 954; 58 KB
-
Butterworth response-ru.svg 744 × 563; 3 KB
-
Butterworth response.png 1,240 × 880; 86 KB
-
Butterworth response.svg 512 × 384; 41 KB
-
Butterworth3 GainDelay.png 882 × 512; 21 KB
-
CIC order 1-3 Frequency Response dB.svg 576 × 432; 78 KB
-
Closed loop gain.png 472 × 319; 15 KB
-
Complex poles Bode plot (module).png 309 × 212; 2 KB
-
Complex poles Bode plot (phase).png 305 × 189; 1 KB
-
Constant Bode plot (module).png 228 × 150; 617 bytes
-
Constant Bode plot (phase).png 204 × 163; 609 bytes
-
Courbe de gain du diagramme de Bode d'un 1er ordre fondamental.png 397 × 298; 10 KB
-
Courbe de phase du diagramme de Bode d'un 1er ordre fondamental.png 388 × 288; 10 KB
-
Delay bode.png 280 × 210; 13 KB
-
Diagrama Bodo FPBanda.svg 927 × 412; 3 KB
-
DiagramaBode.jpg 1,440 × 796; 48 KB
-
DiagramadebodeplantaMF333.jpg 1,280 × 700; 112 KB
-
Diff bode.png 280 × 210; 17 KB
-
Durchtrittsfrequenz im Bodediagram.svg 800 × 520; 14 KB
-
EjemploLoopShaping1.jpg 1,280 × 665; 102 KB
-
EjemploLoopShaping2.jpg 1,280 × 665; 106 KB
-
EjemploLoopShaping3.jpg 1,280 × 665; 118 KB
-
Filt elect pend.PNG 531 × 395; 16 KB
-
FilterAnalysis.png 1,710 × 777; 105 KB
-
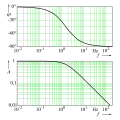
Filtre-passe-bas.png 1,200 × 852; 25 KB
-
Filtre-passe-haut.png 1,200 × 852; 28 KB
-
Filtros electr.PNG 521 × 326; 12 KB
-
Firstorder break.png 1,419 × 829; 28 KB
-
Firstorder freq2.png 1,419 × 829; 31 KB
-
For bode.png 280 × 210; 16 KB
-
For2 bode.png 280 × 210; 18 KB
-
FPBajo mod.JPG 1,280 × 916; 232 KB
-
FPBajo phas.JPG 1,280 × 916; 237 KB
-
FPBanda mod.JPG 1,280 × 916; 236 KB
-
FPBanda phas.JPG 1,280 × 916; 236 KB
-
FPBP1.png 1,320 × 777; 29 KB
-
Frequency response damped LSP-1.jpg 1,667 × 474; 1.05 MB
-
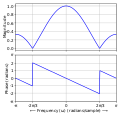
Frequency response of 3-term boxcar filter.gif 640 × 643; 17 KB
-
Frequency response of 3-term boxcar filter.svg 416 × 400; 20 KB
-
Frequency response of ideal and practical integrator-ru.svg 461 × 677; 2 KB
-
Frequency response of ideal and practical integrator.png 524 × 454; 12 KB
-
FrequencyRespOfLeadLagComp.png 561 × 420; 12 KB
-
Gain bode.png 280 × 210; 13 KB
-
Gain Margin.PNG 579 × 252; 39 KB
-
Gain margin.png 568 × 255; 3 KB
-
Gain-bandwidth product-it.svg 412 × 272; 22 KB
-
Gain-bandwidth product.svg 412 × 272; 26 KB
-
High-pass filter.png 1,882 × 1,502; 60 KB
-
HPF NO.jpg 873 × 429; 106 KB
-
Integ bode.png 280 × 210; 16 KB
-
Integral-derivative compensation network Bode plot.png 293 × 290; 2 KB
-
Kantelfrekwentie.png 744 × 559; 284 KB
-
Low-pass filter 2.png 625 × 341; 12 KB
-
Low-pass filter.png 1,882 × 1,502; 59 KB
-
LPF NO.jpg 874 × 430; 104 KB
-
MA2Amp C.png 1,200 × 900; 12 KB
-
MA2Amp C.svg 503 × 508; 63 KB
-
MA2Phase C.png 1,200 × 900; 12 KB
-
Magnitude of feedback amplifier.PNG 575 × 247; 35 KB
-
MagnitudeBode.jpg 391 × 360; 20 KB
-
Notch 50Hz audio filter.svg 461 × 346; 166 KB
-
Open loop gain.png 501 × 343; 24 KB
-
Passive Band-stop filter Bode Plot.PNG 490 × 350; 11 KB
-
Phase for Step Response.PNG 637 × 555; 50 KB
-
Phase Margin.PNG 579 × 245; 42 KB
-
Phase margin.png 568 × 255; 3 KB
-
Phase of feedback amplifier.PNG 579 × 245; 38 KB
-
Pole in origin Bode plot (module).png 286 × 184; 1 KB
-
Pole in origin Bode plot (phase).png 148 × 154; 477 bytes
-
Real pole Bode plot (module).png 325 × 186; 1 KB
-
Real pole Bode plot (phase).png 314 × 189; 1 KB
-
Reflex1.jpg 518 × 197; 13 KB
-
Reflex4.jpg 518 × 197; 17 KB
-
Resonantie-overdracht.png 867 × 486; 19 KB
-
RLC Series Circuit Bode Magnitude Plot.svg 1,971 × 937; 81 KB
-
Room f.png 640 × 480; 7 KB
-
Scidavis-0.2.3.png 1,055 × 800; 116 KB
-
Scilab Bode Plot.png 722 × 668; 53 KB
-
Secondorder freq.png 1,419 × 829; 34 KB
-
Secondorder freq2.png 1,419 × 1,023; 52 KB
-
Spec i bodediagram.png 762 × 541; 9 KB
-
Tiefpass Frequenzantwort.svg 800 × 550; 46 KB
-
TP100Hz Phase log.svg 800 × 550; 88 KB
-
TP100Hz-doppel-log.svg 800 × 520; 26 KB
-
Two-pole Bode magnitude plot.png 881 × 401; 7 KB
-
Unstable zero.PNG 280 × 210; 14 KB
-
Unstaper bode.png 280 × 210; 17 KB
-
АЧФЧ моста Вина - Робинсона.svg 753 × 513; 4 KB
-
Замкнутая система.png 999 × 351; 17 KB
-
ЛАФЧХ1.svg 417 × 692; 61 KB
-
Фильтр Вина.svg 768 × 295; 31 KB

.png/120px-3-dB_bandwidth_definition_(logarithmic).png)



_of_an_Ideal_Differentiator.svg/120px-Bode_Plot_(Frequency_Response)_of_an_Ideal_Differentiator.svg.png)


(s+3).png/120px-Bode-margin_1_over_s(s+2)(s+3).png)




.png/120px-Complex_poles_Bode_plot_(module).png)
.png/120px-Complex_poles_Bode_plot_(phase).png)
.png/120px-Constant_Bode_plot_(module).png)
.png/120px-Constant_Bode_plot_(phase).png)







.png/120px-Pole_in_origin_Bode_plot_(module).png)
.png/115px-Pole_in_origin_Bode_plot_(phase).png)
.png/120px-Real_pole_Bode_plot_(module).png)
.png/120px-Real_pole_Bode_plot_(phase).png)


