Category:Graph images that should use vector graphics
Jump to navigation
Jump to search
English: Images composed of simple shapes, lines, and letters such as those below should be recreated using vector graphics as an SVG file. These have a number of advantages such as making it easier for subsequent editors to edit them, enabling arbitrary scaling at high quality, and sharp high-resolution renderings for print versions. See Commons:Images for cleanup for more information.
Many of these images may be convertible to wikicharts instead of image files. See Template:Convert to wikichart.
This is a subcategory of Category:Images that should use vector graphics. You can add images to this category using the template {{Convert to SVG|graph}}.Wikimedia category | |||||
| Upload media | |||||
| Instance of | |||||
|---|---|---|---|---|---|
| |||||
Subcategories
This category has the following 7 subcategories, out of 7 total.
- Roger Federer in statistics (7 F)
- Test cricketers graphs of India (25 F)
- Virat Kohli in statistics (4 F)
Pages in category "Graph images that should use vector graphics"
The following 2 pages are in this category, out of 2 total.
Media in category "Graph images that should use vector graphics"
The following 200 files are in this category, out of 5,990 total.
(previous page) (next page)-
3ptt en asda foto pattern.png 422 × 613; 139 KB
-
3ptt en cascade of phase transitions.png 1,930 × 3,327; 405 KB
-
3ptt en measurements.png 400 × 629; 98 KB
-
3ptt en traffic breakdown.png 181 × 160; 9 KB
-
3ptt en traffic capacity.png 1,343 × 769; 94 KB
-
3ptt en Traffic flow density plane.png 1,719 × 849; 181 KB
-
3ptt en traffic pattern.png 413 × 364; 44 KB
-
4 Sektoren Modell.jpg 1,058 × 603; 223 KB
-
424Numeri.png 422 × 580; 36 KB
-
458LottBulletEnergy.png 816 × 380; 9 KB
-
458LottBulletEnergy01.png 740 × 378; 9 KB
-
458LottBulletEnergy02.png 731 × 360; 12 KB
-
458LottBulletEnergy03.png 731 × 362; 12 KB
-
458LottBulletEnergy04.png 731 × 376; 12 KB
-
458LottBulletVelocity02.png 723 × 376; 6 KB
-
458LottBulletVelocity03.png 724 × 385; 5 KB
-
458LottBulletVelocity04.png 724 × 385; 7 KB
-
460WbyMagBulletVelocity.png 737 × 414; 7 KB
-
460WbyMagBulletVelocity04.png 737 × 414; 8 KB
-
460WbyMagBulletVelocity05.png 735 × 392; 8 KB
-
460WbyMagBulletVelocity06.png 735 × 392; 8 KB
-
460WeatherbyMagnumBulletEnergy.png 747 × 337; 12 KB
-
460WeatherbyMagnumBulletEnergy01.png 957 × 367; 7 KB
-
460WeatherbyMagnumBulletEnergy03.png 738 × 368; 13 KB
-
460WeatherbyMagnumBulletEnergy04.png 738 × 382; 14 KB
-
4n=2.png 491 × 349; 11 KB
-
4n=3.png 495 × 343; 11 KB
-
4n=4.png 495 × 328; 10 KB
-
5.3 Disp full.PNG 955 × 586; 46 KB
-
5.3 modelsoln Full.PNG 1,030 × 548; 51 KB
-
5.3 modelsoln1.PNG 832 × 602; 32 KB
-
5.3 p1.PNG 642 × 196; 9 KB
-
5.3 particularCheck.PNG 694 × 470; 25 KB
-
5.díl html 29840a23.png 269 × 194; 12 KB
-
5.díl html 2df7f7d2.png 281 × 194; 11 KB
-
5.díl html 358d3a4e.png 282 × 194; 10 KB
-
5.díl html 7979aa8d.jpg 290 × 194; 8 KB
-
5.díl html m30a929e0.png 281 × 194; 11 KB
-
56 nm hp polarized image.PNG 567 × 337; 13 KB
-
6 centrality measures.png 600 × 900; 378 KB
-
6.1n=6-1.PNG 606 × 410; 21 KB
-
615 Age and Bone Mass.jpg 860 × 553; 218 KB
-
65 MJ Klima Änderungen.png 650 × 397; 35 KB
-
6FEBhist.png 1,101 × 699; 52 KB
-
6J7 pentode anode characteristics.jpg 4,320 × 2,765; 4.38 MB
-
6L6 Beam Tetrode anode characteristics.jpg 4,325 × 2,773; 4.46 MB
-
6L6 triode anode characteristics.jpg 4,320 × 2,765; 4.51 MB
-
6s EUV blur vs linewidth.png 540 × 284; 13 KB
-
7 Lebenszufriedenheit.jpg 1,199 × 668; 341 KB
-
777-224 fuel burn-range.png 1,366 × 600; 28 KB
-
7nm node metal pattern shifts through EUV focus.png 514 × 267; 11 KB
-
800px-Pareto fr.png 761 × 526; 49 KB
-
9ms.png 1,436 × 845; 261 KB
-
A chart showing the Official World Chess Champion title holders.png 386 × 350; 10 KB
-
A diagram of The Diverging C Curve.jpg 260 × 260; 7 KB
-
A graph denoting the changing population of Bellerby over time.jpg 481 × 289; 34 KB
-
A graph of the population history of Barugh from 1881 - 2011.png 475 × 283; 4 KB
-
A Missional Perspective.JPG 475 × 310; 61 KB
-
A sample of Receiver Operating Characteristic.jpg 1,713 × 893; 76 KB
-
A simple continuous function which are used to be quantized.png 664 × 357; 12 KB
-
A standard Gaussian distribution for illustration an example.png 782 × 278; 9 KB
-
A Tesla Model S negyedéves értékesítési adatai.png 1,832 × 1,312; 79 KB
-
A union c b union c.JPG 915 × 527; 17 KB
-
Aandeelhoudersstructuur Euler Hermes.PNG 797 × 377; 78 KB
-
Ab=cd-up.png 332 × 244; 39 KB
-
Abgas- und Geräuschreduktion.jpg 1,009 × 691; 69 KB
-
Abgasemissionen.jpg 995 × 702; 54 KB
-
Abiotische-faktor-temperatur.PNG 1,049 × 640; 53 KB
-
Abortion Views 2019.png 583 × 340; 14 KB
-
AbsoluteErrorNumericalDifferentiationExample.png 1,548 × 914; 104 KB
-
Absorbance d'une solution en fonction du temps.JPG 653 × 349; 17 KB
-
Absorption of potassium permanganate.jpg 724 × 321; 47 KB
-
Absorption spectra of various colorants.jpg 665 × 602; 97 KB
-
Absorption spectrum of carotene.png 250 × 231; 11 KB
-
Absorption spectrum of cyan and magenta ink.jpg 992 × 453; 108 KB
-
Absorption spectrum of cyan ink.jpg 992 × 453; 105 KB
-
Absorption spectrum of malachite green.jpg 548 × 432; 74 KB
-
Absorption spectrum of malachite green.png 345 × 204; 6 KB
-
Absorption spectrum of yellow ink.jpg 992 × 453; 110 KB
-
Abstencion Europa.png 646 × 441; 7 KB
-
AC danube acorr.png 901 × 653; 16 KB
-
AC danube base.png 936 × 653; 15 KB
-
Academic Ranking of World Universities.png 1,354 × 997; 140 KB
-
Acceleration1.jpg 1,184 × 928; 88 KB
-
Acceleration2.jpg 1,419 × 1,077; 97 KB
-
ACE numbers.png 412 × 347; 8 KB
-
Ace storm atlantic 1950-2006.png 602 × 412; 174 KB
-
ACE2008 to 2012 support no-vote oppose.png 1,106 × 744; 53 KB
-
ACE2012 cumulative voting rates.png 1,095 × 742; 67 KB
-
ACE2012 daily voting rates.png 1,093 × 744; 58 KB
-
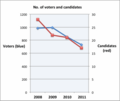
ACE2012 no voters and candidates.png 859 × 722; 63 KB
-
Achern-Population-Stats.png 910 × 583; 98 KB
-
Acigraph.png 560 × 420; 5 KB
-
Acoustics BinauralBeats.JPG 1,095 × 549; 91 KB
-
Acromegaly growth hormone levels.JPEG 810 × 319; 40 KB
-
ACT-36-1997 to 2011.png 563 × 383; 15 KB
-
Actgraph.jpg 595 × 299; 33 KB
-
Actinium series.gif 3,513 × 2,162; 84 KB
-
Action potential vert.png 795 × 1,130; 290 KB
-
Active administrators (September 2002 to present).png 2,462 × 861; 45 KB
-
Active administrators vs active editors.png 2,563 × 1,802; 35 KB
-
Active duty end strength graph.png 429 × 327; 17 KB
-
Active editors on English Wikipedia over time.png 640 × 240; 30 KB
-
ActiveAdmins 05-05-2010.png 923 × 741; 52 KB
-
ActiveAdmins 18-06-2012.png 2,177 × 1,229; 30 KB
-
ActiveAdmins 22-11-2012.png 3,012 × 1,111; 50 KB
-
ActiveWikipedians.PNG 719 × 470; 43 KB
-
Acton Cheshire population graph.png 628 × 345; 5 KB
-
Acuna-Soto EID-v8n4p360 Fig1.png 768 × 599; 38 KB
-
Adapter2.jpg 524 × 236; 16 KB
-
Adapter4.jpg 524 × 236; 15 KB
-
Adaptive Coordinate Descent illustration.png 3,219 × 1,466; 717 KB
-
Adaptive streaming overview bit rates 2011 07 28.png 1,199 × 346; 27 KB
-
Adaptivefilter1.png 899 × 300; 10 KB
-
Add Frac1.png 400 × 400; 4 KB
-
AddTransaction.jpg 911 × 394; 43 KB
-
ADDVOL Model results.jpg 941 × 553; 132 KB
-
Adelaide heat wave 2008.png 977 × 600; 6 KB
-
AdemhalingModel.png 1,060 × 647; 49 KB
-
Adenosine Receptors Down-Regulate Inflammation through a Negative Feedback Loop.png 1,300 × 2,314; 466 KB
-
Adforton total population between 1861 and 1961..PNG 501 × 327; 10 KB
-
AdherentsReligionsPourcentageMondial.png 831 × 534; 32 KB
-
Adicciónala ompra.jpg 960 × 720; 77 KB
-
Admchart.jpg 3,975 × 2,584; 3.13 MB
-
Admin-community-demographics 2018.png 512 × 312; 21 KB
-
Admixture analysis with Native American populations grouped by geographic origin.png 1,730 × 2,000; 2.08 MB
-
Admixturehispanicswest.jpg 324 × 960; 39 KB
-
ADo Schlüsselstellungen.png 445 × 307; 17 KB
-
ADSL Line Rate Reach.gif 418 × 369; 7 KB
-
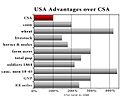
Advantages.jpg 1,325 × 1,108; 179 KB
-
AdvLIGO noise curve.webp 765 × 545; 86 KB
-
AdygheConjugation.jpg 545 × 476; 54 KB
-
Adö111.jpg 632 × 464; 141 KB
-
Adöadresdönüsüm111.jpg 726 × 261; 70 KB
-
Adösatır111.jpg 499 × 112; 46 KB
-
Aegypt-fourth-dynasty-stone-movements.png 595 × 562; 7 KB
-
Aerial image change with phase.jpg 1,898 × 554; 109 KB
-
Aerodynamic relations for delta wings 1.jpg 1,848 × 909; 92 KB
-
Aeroflot Group fleet size.png 1,337 × 1,127; 76 KB
-
AEX performance.jpg 2,369 × 1,346; 241 KB
-
AF447Cross-Section-IT.jpg 2,322 × 2,297; 898 KB
-
AF447SeaBottom-it.jpg 2,808 × 2,500; 3.8 MB
-
Afd exemple.png 566 × 308; 4 KB
-
AFD minimal.png 600 × 166; 23 KB
-
AfD probabilities.png 1,020 × 846; 24 KB
-
AFD redundante.png 600 × 334; 39 KB
-
Afdiag3.jpg 756 × 209; 29 KB
-
Afghan National Army OrBat.png 1,916 × 946; 36 KB
-
Afghanistan population pyramid 2005.png 501 × 251; 2 KB
-
AFL-NFL merger.png 1,513 × 983; 102 KB
-
Afli leturhumars 1992-2013.jpg 615 × 393; 18 KB
-
Afli villtra og ræktaðra skelja.jpg 529 × 308; 36 KB
-
AFM fig1.jpg 210 × 209; 5 KB
-
AFM fig2.jpg 209 × 210; 7 KB
-
AFM fig3.jpg 434 × 434; 17 KB
-
AFM fig4.jpg 435 × 434; 15 KB
-
AFM fig5.jpg 521 × 519; 22 KB
-
Afn exemple.png 497 × 192; 2 KB
-
AFND to AFD 1.png 600 × 163; 8 KB
-
AFND to AFD 2.png 600 × 377; 25 KB
-
AFND to AFD 3.png 600 × 377; 16 KB
-
African crop production.png 1,504 × 1,048; 135 KB
-
Afrika Carré.jpg 322 × 515; 22 KB
-
Afrika Rectangle.jpg 424 × 471; 27 KB
-
Afrika Triangle.jpg 498 × 530; 36 KB
-
AFTv5.phase 2.utility prop.by experiment.by aggregation.barplot.png 2,048 × 1,024; 56 KB
-
AFTv5.phase 2.utility.by intention.by experiment.png 2,048 × 768; 52 KB
-
Age and Sex Distribution of Major Foreigners in Japan en.png 1,174 × 805; 140 KB
-
Age distribution graph United States Presidents.png 1,600 × 1,190; 180 KB
-
Age Distribution in Cobourg 2006.png 1,048 × 728; 20 KB
-
Age groups Karlstad.png 635 × 517; 21 KB
-
Age of VPs Graph.png 449 × 310; 5 KB
-
Age personal income.png 315 × 462; 11 KB
-
Age.png 930 × 858; 63 KB
-
AGES0.JPG 666 × 593; 80 KB
-
Aglomerace.PNG 675 × 316; 12 KB
-
Agricultural surplus.jpg 377 × 242; 28 KB
-
AHPJones03.png 1,200 × 595; 119 KB
-
Air France-KLM Group fleet size.png 1,540 × 1,538; 110 KB
-
Air pollutants, manufacture of clay.png 1,020 × 267; 29 KB
-
Air polution graph.JPG 705 × 355; 25 KB
-
Air polution graph1.JPG 631 × 363; 22 KB
-
Airborne-particulate-size-chart Chinese.png 1,040 × 1,160; 762 KB
-
Airbus Boeing net orders 2002 2006.png 970 × 604; 22 KB
-
AircraftCompressorDischargeTemperatureVSAltitude.jpg 1,385 × 1,068; 233 KB
-
Airpressureonvenus.PNG 579 × 480; 12 KB
-
Airy supportcoefficient 0,2113 s.jpg 945 × 606; 77 KB
-
Aki-Imuro sta graph.jpg 402 × 279; 23 KB
-
Akinagatsuka sta graph.jpg 533 × 334; 19 KB
-
Akupunjenje.jpg 409 × 528; 38 KB
-
Al-Elko-Impedanzverläufe-Elko-Polymer-Wiki-07-02-19.jpg 800 × 562; 157 KB
-
Alaska Oil Production 1975 to 2005.png 500 × 500; 9 KB













%2C_pp._113-122.png/120px-Age_case_fatality_rates%2C_covid-19_data_in_China_CDC_Weekly_2020%2C_2(8)%2C_pp._113-122.png)


